The LabFantasyBetaArticlesMy Hub
Sign up
  • About
  • Contact
  • Privacy
  • Terms

Independent, not affiliated with or endorsed by the NFL. · © 2026 YUNO Sports · Data: nflverse (CC BY 4.0), modified

All articles

Air Yards Mostly Don't Matter... Mostly

Every broadcast loves a quarterback who pushes the ball downfield. The scoreboard is much less impressed.

By YUNO Jon/Nov 19, 2026/6 min read
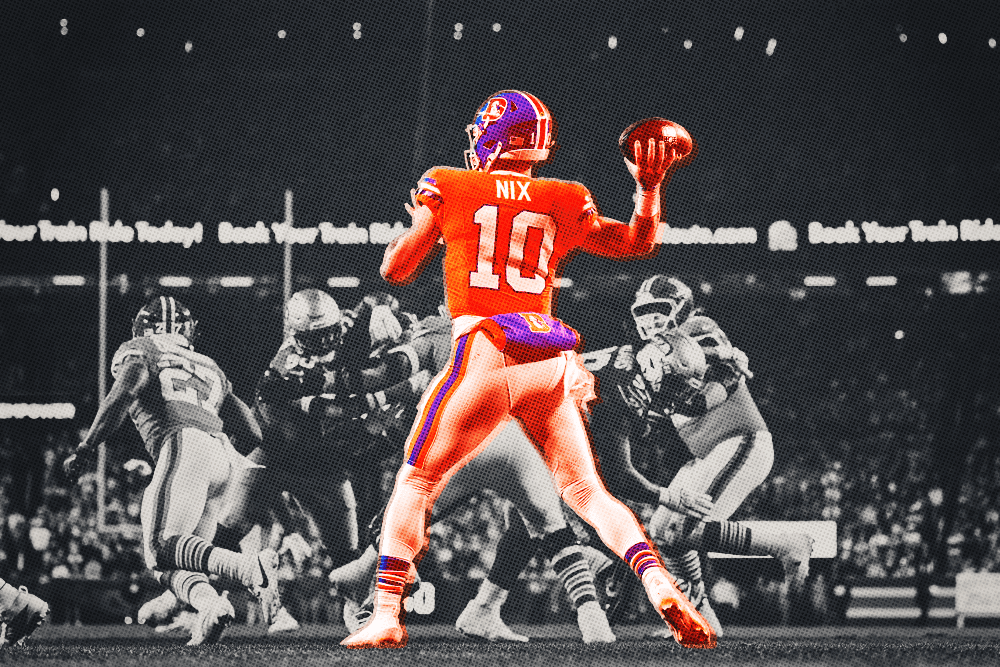
bo-nix-seattle-duotone
Icon Sportswire

Air yards, or average depth of target (ADOT), measure how far downfield a pass travels beyond the line of scrimmage, excluding yards after the catch. They're a hot topic again, and we have one person to thank: Bo Nix.

Through Week 9, Nix has the shortest passes in the league, 5.6 air yards per throw. If that holds, he would finish with the shortest season of any starter since David Carr in 2006. His passing chart is peppered around the line of scrimmage, and even his big plays are often glorified dump-offs. Ryan Fitzpatrick called Nix's play "almost disrespectful to the quarterback position." Yet, thanks to an excellent defense and a knack for winning one-score games, Nix and Denver have not paid much of a price for their unsustainable play style.

Or maybe it's not Nix's fault that we're talking about ADOT. In fact, maybe it's YOUR fault for talking about something so silly. Air yards are about style points. Who cares how far the ball travels if you're scoring, protecting the football, and winning games? Denver is doing all three. Just look at Drew Brees. A potent offense doesn't need to push the ball downfield, and perhaps Denver's short-passing approach is exactly what allows its defense to thrive.

So who's right here: Dr. Jekyll or Mr. High-ADOT? I dug into the numbers to find out if air yards mean a damn thing.

Do more air yards mean a better offense?

The figure plots air yards (measured several different ways) on the horizontal axis against offensive performance (also measured several ways) on the vertical axis. You can also use the middle dropdown to look at various situations.

The goal is to see how much of offensive quality can be explained simply by passing depth. The answer? Almost none. Plot air yards per attempt against virtually any measure of offensive performance, and you'll find little to no correlation. How far a quarterback throws the ball tells you remarkably little about how good an offense is. Great offenses throw short, bad offenses throw deep, and vice versa.

But play around with the measures, and you might find an exception: a way in which passing depth actually does tell us something about offensive quality.
Loading chart…

Throw it past the first-down marker when you need a first down

On 3rd and 4th down, depth starts to matter, but only when you measure it against the first-down marker. Raw air yards still explain just 3% of offensive EPA. Yards past the sticks explain 9%, and the plain share of throws that reach the sticks explains 11%. The ball doesn't need to go far. It needs to go far enough, and only on money downs.

Loading chart…

Trends over time

Offenses have been throwing shorter, but only on early downs.

Loading chart…

The league has been throwing shorter on early downs for a decade, dropping from 8.1 air yards per attempt in 2016 to 7.3 in 2025. Through Week 9, the 2026 season is tracking at the same 7.3. On late downs, however, passing depth has remained virtually unchanged.

Perhaps this reflects the different importance of depth depending on the situation:

  • Early downs: Depth is less essential, leaving room for trends driven by defensive coverages, run-pass splits, and other strategic factors.

  • Late downs: Getting the ball past the sticks has always been important. That was true a decade ago and remains true today, leaving little reason for passing depth to change.

The Goldilocks depth

Just past the marker: at every distance, conversion peaks for throws aimed about 3 yards past the sticks, at 67% on 3rd-and-1-to-3, 59% on 3rd-and-4-to-6 and 51% on 3rd-and-7-plus.

Loading chart…

Every line peaks between 2.5 and 3 yards past the sticks. Short of the marker the rate falls off fast; past the peak it slides more slowly.

The gray hump along the bottom is where the throws actually went. The distribution of throws peaks right at the sticks, which contrasts with the optimal conversion rate distribution.

To read the rest of this article, please subscribe to a Pro account.

Upgrade to Pro
Tags
  • QBBo Nix
  • QBPatrick Mahomes
  • QBDavid Carr
  • QBRyan Fitzpatrick
  • QBDrew Brees
SharePost on X

Read next

  • minny-balto
     Where Have All the Seconds Gone? 

Is it the aim or the distance?

One complicating factor is that aim and distance travel together: the longer the down, the farther short of the sticks quarterbacks tend to throw. So a chart of aim might just be a chart of long downs in disguise.

To check, I compared throws at the same distance. On 3rd-and-6, a throw aimed 6 yards short converts about 25% of the time, one aimed 3 yards past about 58%, and one aimed 20 yards past about 35%. Then I compared throws with the same aim. Aimed 3 yards past the sticks, 3rd-and-2 converts 67% and 3rd-and-8 converts 53%. Both matter, and the sweet spot doesn't move: it's about 3 yards past the marker on 3rd-and-2 and on 3rd-and-9.

Loading chart…

What about throws into the end zone?

The first-down marker isn't the only important landmark on the field, and arguably isn't even the most important. I wondered whether the same principle applies near the goal line: Is there a sweet spot just beyond the line to gain?

The answer is a definite maybe ¯\_(ツ)_/¯

Touchdown rates increase the closer to the goal line the QB throws. Beyond that, the data can't say. Air yards stop at the goal line, so every end-zone throw is recorded at the same spot, whether it's a fade to the back line or a dart at the pylon. It's possible there's a similar sweet spot just inside the end zone, but that pattern gets obscured by declining rates as throws travel farther into it. In other words, the true peak may be just beyond the goal line, but the lower rates farther into the end zone wash it out.

Loading chart…

Here's what we can say: Throws into the end zone (within 10 yards beyond the goal line) produce touchdowns 38% of the time. Throws into the 10 yards just short of the end zone? Only 20%. Even throws aimed within 5 yards of the goal line produce touchdowns just 28% of the time.

Whatever the down and distance, aim at the goal line or past it. That might sound obvious, but consider this: throws aimed 1-5 yards short of the goal line are completed far more often than end-zone throws (59% vs. 38%), yet produce touchdowns far less often (28% vs. 38%). An end-zone catch is a touchdown. A catch short of the line still has to get in, and most don't. The exception is the last yard: throws aimed 1 yard short score 42%, because a catch there usually falls in.

Who gets past the sticks?

situation where it actually matters: third and fourth down. While we’ve established that the sweet spot is 1–2 yards beyond the sticks, it’s hard to argue for anyone other than Brock Purdy. He throws past the sticks more than anyone else, and he also boasts the second-highest conversion rate on third and fourth down.

Mahomes is another interesting case. Until this past weekend, he was on pace for the lowest ADOT in 20 years. Yet even with all those short throws, his ADOT in the one situation that matters is completely normal.

Loading chart…

The takeaway

When a broadcast says a quarterback is "pushing the ball downfield," it is describing a style. Nix and Mahomes throw exactly the same distance, yet through Week 9 Kansas City is 5th in EPA per play and Denver is 18th. The gap shows up where this article says it should: on 3rd and 4th down, Kansas City's throws reach the sticks 61% of the time and Denver's 50%, 31st in the league. How far the ball goes doesn't matter. How far past the line does, whether that's the sticks on 3rd down or the goal line in the red zone.

Filter any team's throws by air yards and down in the Lab to check a favorite.

Data: nflverse (CC BY 4.0), modified.

Oct 22, 2026 · 6 min
  • burrow-balto-noblur
    Making Sense of Joe Burrow's Clutch StatsOct 2, 2026 · 7 min
  • San Francisco 49ers tight end George Kittle sits on the back of an injury cart, still in his helmet, as a trainer rides beside him off the field.
    Injuries Suck, Our Health Metrics Don't. Part 1: AttritionSep 17, 2026 · 6 min
  • All articles