Analysis
Injuries Suck, Our Health Metrics Don't. Part 1: Attrition
We built a metric to measure injury impact. Here’s what we found.
By YUNO JON//6 min read
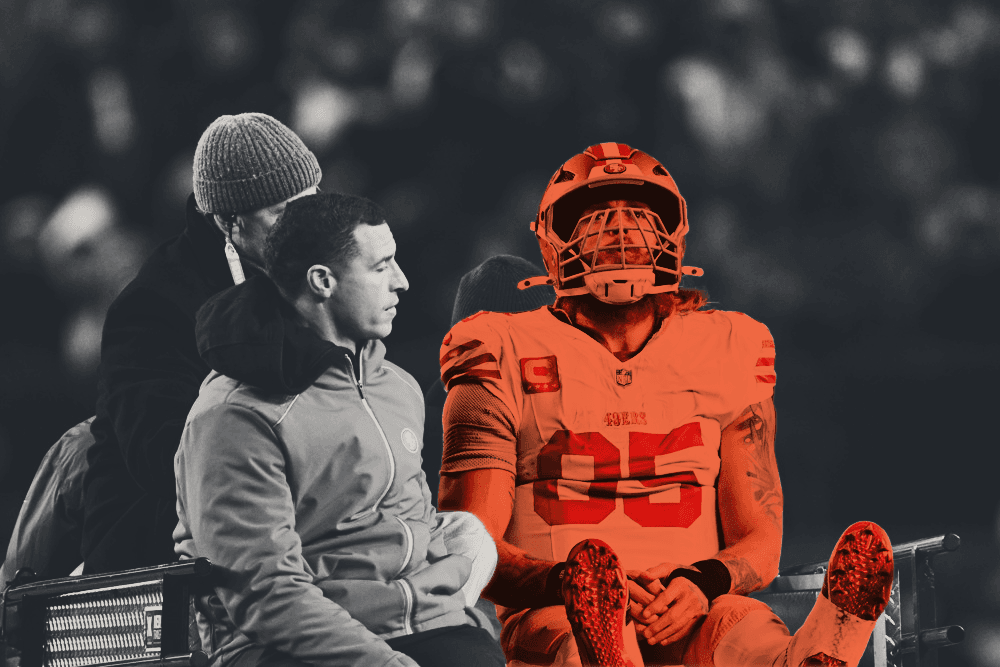
One of the biggest and most frustrating factors in sports, especially football (and especially if you're a Chargers or 49ers fan), is health. Every season, injuries derail promising teams, and by the time the conference championships arrive, the teams left standing are often not just the most talented or best coached, but among the healthiest.
Yet there are surprisingly few ways to quantify their impact in a meaningful way. YUNO Sports has two:
Availability, which tells you, in a given week, how intact a roster is, based on who's on IR and the injury report.
Attrition, which tells you, over a full season, how injury-impacted a team was.
This article is doing a deep dive on Attrition. Here's where it holds up, and where it doesn't.
How is the Attrition score calculated?
The Attrition score looks at each team's starters and grades them every week on three things:
In a given game, are they playing as much as expected? We establish an expected snap count based on position, game context, and established usage. A QB or OL should generally play more than a WR, for example, while starters should be expected to play fewer snaps in a blowout. Attrition looks for meaningful gaps between expected and actual playing time.
If playing time drops, is there evidence that an injury caused it? Playing time can decline for reasons unrelated to health, including performance, coaching decisions, or changes in personnel. If a player plays fewer snaps than expected but there is no indication an injury was responsible, that reduction does not count against the team’s Attrition score.
Are there players playing a full snap count who are nevertheless on the injury report? A player can be listed on the injury report and still play a full complement of snaps while dealing with an injury that affects his performance. Attrition captures this as well.
A less careful metric can mistake a team being bad for being injured. Bad teams might bench or rotate starters looking for answers to their problems. Drops in snap counts can happen because they're bad, not necessarily injured. More on that issue in a bit.
Loading chart…
Those player grades are combined into a team score, with different positions and units given different weights, fine-tuned in proportion to how much they impact the game.
Healthy teams do better than injured teams (the "no duh" part)
As a first pass we correlated Attrition with various measures of success. It's negatively correlated with both wins and net EPA/play (how good a team is on a per-play basis), which is what you'd expect: more attrition means fewer wins and less EPA. It slightly underperforms Adjusted Games Lost (AGL), created at Football Outsiders and now published by FTN Fantasy, a count of games missed weighted by who missed them, that analysts have leaned on for nearly two decades. The R² here tells you that across the two measurements, Attrition explains about 8-13% of a team's success. This means the remaining ~90% is explained by the talent on the roster, coaching, scheme, schedule, random noise, etc. We shouldn't expect Attrition to explain everything, but 10% is nothing to sniff at.
Loading chart…
It is not just measuring good teams
Building a metric that correlated with team quality was the easy part, but one of the first things we learned was that there are plenty of ways for a bad team to look injured. Coaches might bench players while searching for solutions, rotate personnel to address roster problems, or put starters on ice as a season slips away. Any of these can trigger our snap-loss detector without anyone actually being injured.
We feel confident that we're not capturing that here, because neither Attrition nor AGL explains much of the preseason Vegas win total (see above). It’s not that the teams expected to be bad were simply showing up as more injured. We generally have a good idea before the season which teams are likely to struggle, have an unsettled QB situation, or make the kinds of personnel changes that can create misleading snap-loss signals. Because Attrition and AGL are designed to account for those effects, they don't show up as a relationship with preseason win totals. How much a team under- or overperformed that expectation, on the other hand, is correlated with Attrition.
Another way to look at this (and to quantify the impact of staying healthy versus getting injured) is shown below.
Loading chart…
Those gray bars tell you that there was no difference in the expectations for teams that went on to stay healthy or went on to get injured, but there are differences in how they performed. The healthy teams won about 9.2 and the depleted about 6.6, a ~2.6-win gap the market never priced. The rosters were judged equal going in, so the bulk of that gap is the thing the market couldn't see in August: who stayed healthy.
It's not just a quarterback injury detector
We mentioned earlier that we weight different positions based on their impact on the game, and it should come as no surprise that quarterbacks receive the most weight. Teams whose QB was listed as Out won 38% of their games, compared to 51% when their quarterback was available. A metric that counted only QB injuries could probably provide some value, but it would be limited.
To make sure that alone wasn't what was driving the results, and that injuries at other positions were meaningfully adding value, we re-ran the previous analysis after excluding every team in which the QB was injured.
The sample drops from 401 to 345 team-seasons, but the story remains the same: teams that piled up injuries underperform expectations, while healthier teams outperform them. Notably, the win gap between the healthiest and most banged-up teams falls only slightly, from 2.6 wins to 2.4, even with QB injuries removed.
Loading chart…
Does Attrition stick year to year?
You might assume injuries are pure luck that shouldn't repeat. Half true. The correlation between this year and next year's Attrition is 0.11, which again puts it in that "doesn't explain everything, but still nothing to sniff at" category. So if your favorite team was very injured last season, be prepared for them to probably be a little injured this season.
It isn't a hidden "buy-low" signal either
The impact of injuries on wins and the year-to-year carryover in injuries are both weak but meaningful effects. It might therefore be tempting to think this year’s injury level has some predictive value for next year’s record.
It doesn’t. The correlation between this year’s Attrition and next year’s wins is just 0.03, essentially zero. In practical terms, how injured a team is this year tells us virtually nothing about how many games it will win next year.
We can try to denoise this further by accounting for the team’s record, for example, asking: “Between two 10–7 teams, does the banged-up 10–7 team perform any differently the following season than the healthy 10–7 team?” Again, the answer is no. Among teams with the same record, there is no meaningful relationship between their injury level and their win total the following season.
The bottom line
Attrition does what it promises. It flags the genuinely depleted rosters, makes the quarterback the dominant factor he should be, and it measures injury, not team quality: it's essentially uncorrelated with preseason expectations and it matches the field's established injury metric. Over a season, being banged-up costs a team a couple of the wins it was supposed to get.
Loading chart…
SharePost on X
All articles →