The LabFantasyBetaArticlesMy Hub
Sign up
  • About
  • Contact
  • Privacy
  • Terms

Independent, not affiliated with or endorsed by the NFL. · © 2026 YUNO Sports · Data: nflverse (CC BY 4.0), modified

All articles

Making Sense of Joe Burrow's Clutch Stats

Two different clutch stats tell two completely different stories. How can they both be true at the same time?

By YUNO Jon/Oct 2, 2026/7 min read
burrow-balto-noblur

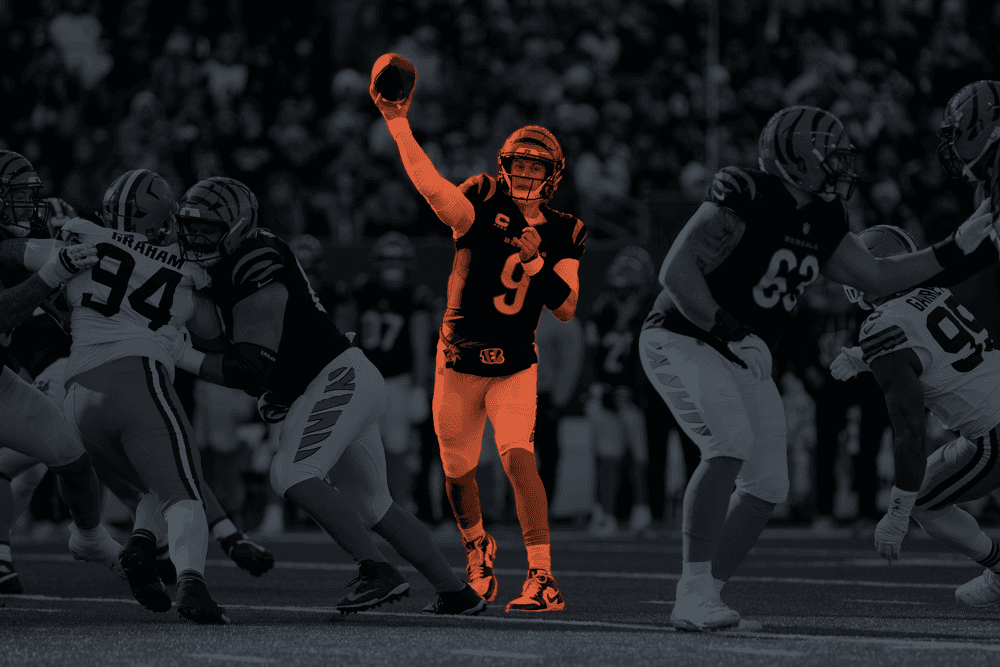
Is Joe Burrow Clutch? The Numbers Are More Complicated Than 1-34

The topic du jour is whether Joe Burrow is clutch. The stat floating around is that he's 1-34 when trailing late (but see notes). Among notable quarterbacks, none are worse.

The counterargument is EPA/play, which says Burrow is among the best - if not the best — quarterback in the league in these situations.

How can both be true? Is someone lying? Or are these numbers measuring different things? Let's line them up.

The disagreement is real

Below is EPA/play and win percentage for 38 active and retired quarterbacks over the final eight minutes when their team was trailing. Each dot is a quarterback; Burrow is the one with the ring around him.

He's in the bottom right: very high EPA/play, very low win percentage. He's fourth of 38 in EPA per dropback and last of 38 in win percentage.

Loading chart…

Drag the slider to change how much of the fourth quarter you're looking at, and select any combination of down 1–8, down 9+ and tied. Restrict it to one-score deficits and the gap gets even bigger: Burrow has the highest EPA/play and the worst win percentage.

Move the slider and he stays in that bottom-right corner through the second half of the fourth quarter. When down one score, he's top three in EPA/play at every window from the final two minutes through the entire quarter, while ranking 35th or worse of 38 in win percentage through the final ten minutes.

So the disagreement isn't a statistical mirage. Burrow really does produce efficiently in these situations while his team rarely wins.

Drive-by-Drive

So how can one quarterback look this good by EPA and win so rarely?

Let's look at the drives instead of the averages. From here on, we use the same window as the "1-34" stat: the final eight minutes.

Here are all 24 of Burrow's drives that reached the final eight minutes while Cincinnati was down one score, eight points or fewer. A drive counts if any of its plays came inside those eight minutes, so a few begin just before the window.

We've sorted them into three piles:

  • Ones where the clutch drive won the game (simple!)

  • Ones that truly failed (also simple!)

  • Ones where there was either a successful drive in a loss, or the drive failed in an atypical way (complex)
Loading chart…

Only one drive ended in a win: the 60-yard touchdown at New Orleans in 2022, which took one snap.

Twelve truly failed. You can dig into the details of those failures.

The other 11 are where it gets interesting. Nine succeeded (they tied the game or gave Cincinnati the lead) but CIN lost anyway. The other two fell short because of a kick or conversion:

  • In the 2020 opener, CIN drove to the LAC 3-yard line. A touchdown was erased by a pass interference penalty that moved the ball back to the 13, and the 31-yard field goal that would have tied the game missed with seven seconds left.

  • @ BAL in 2024, a touchdown with 42 seconds left made it a one-point game, but the two-point try failed.

So of Burrow's 24 late, one-score drives, half truly failed, 10 tied the game or took the lead, and two more fell short because of a kick or conversion.

The clutch drive analyzer

This is why it's useful to look at drives rather than just game outcomes. It's also the idea behind the Clutch Drive Analyzer on this site.

A drive counts as a success when it ties the game or takes the lead. The bar shows the share of a quarterback's drives that did so. It starts with the final eight minutes, down one score, and uses the same controls as the first figure.

Loading chart…

Here's what it says: Burrow turned 10 of 24 one-score drives into a tie or lead, a 42% success rate. That's 13th of 31 quarterbacks with at least 10 qualifying drives — slightly better than average, but not elite.

Exclude the 2020 opener's missed kick and he moves to 11th. Expand the window to nine minutes and he trails only Mahomes among the top group


There are a plenty of way to skin a cat or set the clutch drive analyzer, but none of these versions show Burrow as poor at leading late drives, particularly when Cincinnati is trailing.

To read the rest of this article, please subscribe to a Pro account.

Upgrade to Pro
CIN
SharePost on X

Read next

  • San Francisco 49ers tight end George Kittle sits on the back of an injury cart, still in his helmet, as a trainer rides beside him off the field.
    Injuries Suck, Our Health Metrics Don't. Part 1: AttritionSep 17, 2026 · 6 min
  • seattle_neutralgray
     Where have all the passing yards gone? 

He loses a lot of games with a successful clutch drive

If Burrow is mounting successful clutch drives at a reasonable rate but still losing these games, there must be a lot of losses in which he successfully mounted one.

There are.

Below is the win percentage of each quarterback's team in games where he had at least one successful clutch drive in the final eight minutes while down a score.

Loading chart…

In those games, Burrow's team won 1 of 10, the lowest rate among 31 quarterbacks by a wide margin. The next lowest are C.J. Stroud (2 of 5) and Jacoby Brissett (5 of 11). The group as a whole wins about 63% of the time.

The sample is small: just 10 games. But Cincinnati lost nine of those 10.

In eight of those nine losses, the other team scored the deciding points on its final possession: four field goals in the final five seconds of regulation (Dallas, Baltimore, Houston and Cleveland), three field goals in overtime (Green Bay, San Francisco and Pittsburgh), and a touchdown with 16 seconds left (Cleveland, 2020).

The kicker here is the, um, kicking

Finally, the kicking.

This is win probability added (WPA) by every field goal and extra point, made or missed, in the final 10 minutes of the fourth quarter while the kicking team was down a score, from 2020 to 2025. A make adds WPA; a miss takes it away. A WPA of 1.00 represents one full win.

Loading chart…

CIN's kickers were below average, but not disastrous: net -0.18 WPA, 24th of 32 teams. The average team was +0.33.

CIN's 20 makes in 23 attempts added 0.47 WPA, while three misses took away 0.64. The gap between Cincinnati and an average team amounts to roughly half a win over six seasons. That's real, but small compared with how those nine games ended.

Is Burrow clutch?

Down one score late, the numbers pretty definitively say yes.

He moves the ball as well as anyone, ranking first in EPA/play. He turns drives into a tie or lead at a better-than-average rate, ranking 13th of 31 quarterbacks. Unfortunately for him and the Bengals, in the games where he does that, CIN has often lost because of what happened afterward. There's an argument that in these situation the Mahomes is probably the only other QB you'd want.

The only caveat here, is that YUNO Sports, and perhaps you personally, would include tied situations in the definition of clutch. One-score deficits are only part of the clutch picture.*

Tied drives outnumber one-score drives 33 to 24, and Burrow is closer to middle of the pack when asked to turn a tie into a lead. Combine tied and one-score situations and he's still fourth in EPA/play, but 28th of 38 in win percentage and 28th of 35 in clutch-drive success.

So he's good and the answer depends a bit on how YOU define "clutch", but there is no QB or offensive centric measure that look even close to as bad as the 1-34 would suggest.

tl;dr

"1-34" is more a team stat than a Burrow stat. Down a score late, he's very efficient and a better-than-average finisher of clutch drives, but nine of the ten times he tied it or took the lead, Cincinnati lost, usually on the other team's last possession. That's an end-of-game problem more than an offense problem.

Notes

The "1-34" figure. We don't reproduce it. Depending on the definition (his snaps while trailing; games he played in where Cincinnati trailed; any amount of time) the final-8 record comes out between 1-29 and 1-32. There is at least one game (BAL @ CIN, 2024) that he lost in OT having never trailed in regulation.

* We also include leading situations where you can bleed the clock, extend the lead to two scores, or effectively end the game. Thats a topic of a bigger discussion but you can see those numbers on the Clutch Drive Analyzer.

Sep 15, 2026 · 6 min
All articles