The LabFantasyBetaArticlesMy Hub
Sign up
  • About
  • Contact
  • Privacy
  • Terms

Independent, not affiliated with or endorsed by the NFL. Ā· Ā© 2026 YUNO Sports Ā· Data: nflverse (CC BY 4.0), modified

← All articles
Analysis

šŸŽµ Where have all the passing yards gone? šŸŽµ

It’s been a while since we have had a 5k yard passer, but why?

By YUNO Jon/Sep 15, 2026/6 min read
seattle_neutralgray
Icon Sportswire

Twilight of the QB Gods

We used to be a proper country, with real QBs, at least by the numbers. From 2011-2013 we had six 5000 passing yard seasons. We had another three in 2018-2019 and a brief little boost in 2021 when the expansion to 17 games yielded three more (2021 Brady and Herbert; 2022 Mahomes). Since then only one season has crossed even 4800 yards.

Shouldn’t we be seeing more of these 5k seasons, not fewer? Not none?

It's not just the top of the league passers that are coming down, either. The figure below shows that league wide, passing yards peaked in 2015 and have been sliding ever since: from 259.2 yards per team-game down to 225.0, a loss of 34.2 yards every game.

What's going on? What's happening here? Where did those 34 yards per game go?

Loading chart…

QBs didn't get worse, they're just throwing it less

The Boomer Takeā„¢ to explain the decline in passing numbers is simply that QBs are not as good as they used to be. We used to have Brady, Manning, Brees, Rivers, Roethlisberger and a good version of Aaron Rodgers. Now we have a bunch of kids who can't play the game as it's meant to be played and are taking off and running half the time.

While we did see the retirement of a lot of the greats over the past 5-10 years, it turns out that the production on a per play basis has been pretty stable as shown below.

Loading chart…

Per pass attempt, the five best passers in each season went from 8.40 yards in 2015 to 8.42 in 2025. Switch the figure to count dropbacks and the denominator picks up sacks and scrambles, which carry no passing yardage at all. On that count those same five go from 7.66 to 7.45, a drop of about 2.5%.

It’s not nothing, but also not enough to explain the drop in passing numbers.

If a quarterback gains roughly the same yardage every time he throws, and the yardage is falling anyway, then he is throwing less often. Indeed, attempts per team-game went from 35.64 in 2015 to 31.91 in 2025. That is 10.5%.

Put this information together and you'll see about four-fifths of the decline is explained by teams throwing fewer passes. Only about one-fifth comes from getting less out of each attempt.

Fewer passes called, and fewer of those calls thrown

On a per play basis, two things are happening at once to decrease pass attempts, and they are close to the same size.

  1. Teams now call a pass on 60.5 percent of their plays, where in 2015 they called one on 62.6.

  2. And of those calls, only 87.6 percent still end with the ball in the air, compared to 90.3 percent a decade ago. The rest are sacks and scrambles.

Loading chart…

Multiply the two and you have the share of all plays that become a throw: 53.0 percent now, 56.5 then. So a little bit of what is being called, and a little bit of what's happening after the ball is snapped, are working together to decrease the percent of plays the ball is thrown on.

Fields are getting a bit shorter...but drives are getting longer

I recently saw a discussion on Twitter about the decline in big passing numbers, and the most common explanation (The Zoomer Takeā„¢?) was that the new kick off rules were driving it. Better field positions, fewer yards to eat up per drive = fewer passing yards.

Loading chart…

The effect is there but perhaps not as big a difference as some may have thought. The reason for this is that while field position after kickoffs has improved, the field position after punts has gotten somewhat worse. In this push and pull, the field position after kickoffs wins the day and as a result teams are on average 3.3 yards closer to their opponent's end zone than they were a decade ago.

I can show you the math on how that 3.3 yards could add up, but let's just forget that, because while intriguing, that idea turns out to be dead on arrival. Not only have drives not shortened, they've gotten longer.*

Loading chart…

Put the two together and offenses are doing more with less. In 2015 a drive started on its own 27 and gained 29.5 of the 72.8 yards in front of it (40.5%). In 2025 it starts on its own 30.5 and gains 30.4 of 69.5, which is 43.8%. The field got shorter but offenses ate a bigger share of what was left.+

Pro

Pro unlocks the rest of this piece — including ā€œPass rate, and how often a call becomes a throwā€ and the charts below it.

Upgrade to Pro
SharePost on X

Read next

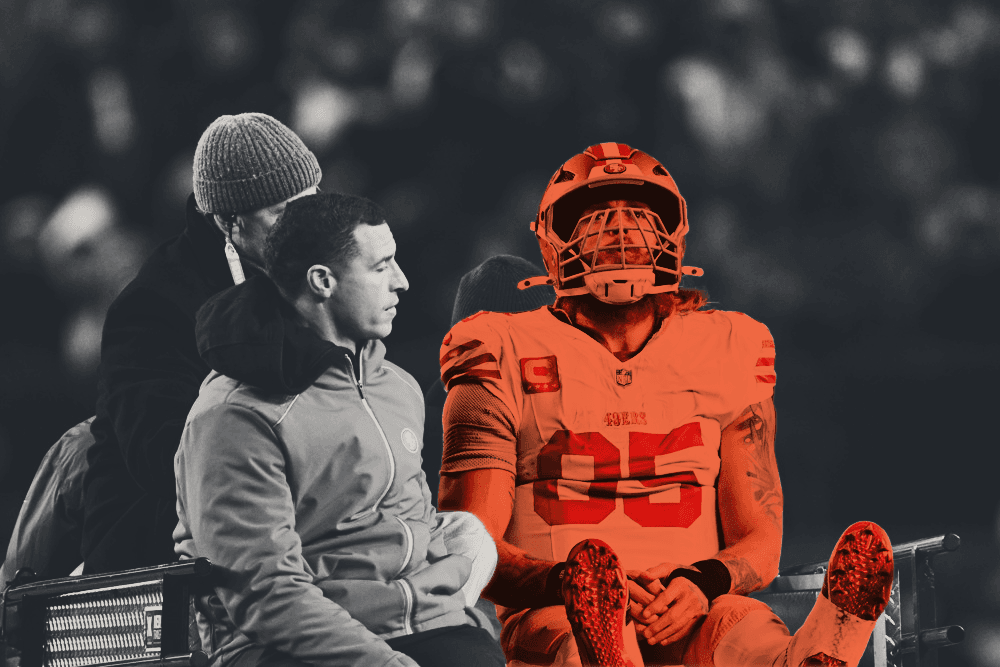
  • San Francisco 49ers tight end George Kittle sits on the back of an injury cart, still in his helmet, as a trainer rides beside him off the field.
    AnalysisInjuries Suck, Our Health Metrics Don't. Part 1: AttritionSep 17, 2026 Ā· 6 min
All articles →

The Long Slow Drive

If the number of yards per drive is going up or staying flat, but the total yardage is going down there can be only one explanation: fewer drives.

And indeed, the number of drives per game has been falling for most of the past fifteen years. From the 2015 peak to 2025 it dropped 9.5%, or 2.1 fewer drives a game. In fact if you look at total drives per season, we have fewer now than we had in 2011 despite adding a game.

Loading chart…

So what's driving the fewer drives? Two things:

  • First, drives have gotten a little longer. Teams went from about 5.7 plays per drive in 2015 to 6.0 in 2025, while the time between snaps also increased.

  • Second, each individual play takes a little longer to run. Neither change is huge on its own, but together they add up.

The result is about one fewer possession per team per game: 11.1 drives in 2015 versus 10.1 in 2025. At roughly 30 yards per drive, that missing possession is worth about 32 yards of offense per game.

And the extra game in the schedule doesn’t change the basic picture. Teams averaged 178.2 drives across 16 games in 2015, compared with 171.4 across 17 games in 2025.

Now that we have a clearer picture, let’s do the accounting.

Where All Those Yards Went

So what about those missing 34 yards a game? Here is the whole argument in one figure. Of the 34.2 yards of passing each team lost per game between 2015 and 2025, the biggest slice, about 24 yards, is possessions that never happened. Longer drives handed about 13 of them back. The rest is teams throwing on a smaller share of the snaps they did get, about 16 yards, and quarterbacks getting slightly less for each throw, about 7.

Loading chart…

Why a snap now costs a second and a half more than it did is a separate question with a separate answer, and it is the subject of the next piece.

Notes:
* If we focus specifically on field goal drives, those HAVE gotten a wee bit shorter over the years, probably a result of better kicking, which was another idea I saw thrown out quite frequently, but overall drive length has actually gone up.

+ We probably got a bit over our skis in the first place even thinking that 3.3 yards could matter THAT much. Not all drives start after kickoffs and most drives do not even end in TDs so the "fewer yards available to eat up" idea overstates how much this impact could be.